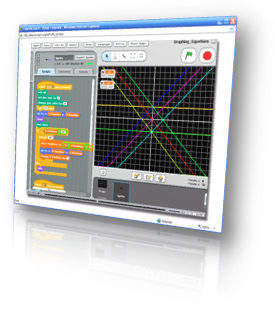
MA-03: Graphing EquationsThis project illustrates the graphical representation of mathematical equations, in this case linear equations. It allows the user to enter the two parameters of the equation, and changes colors as a new curve is plotted. It allows easy expansion to represent more complex curves - parabolas, hyperbolas, ellipses, other polynomials, etc. (click on the image to see the video)  Project created by: kitty
|